

By providing Point data in CSV file, that is by providing a file having Easting (X), Northing (Y), Elevation (Z) data as input, you can create contour map having Contour lines at the specified interval. You can specify the grid spacing to generate the grid line and respective grid elevation depending on point data provided. You can also generate the Contour based volume report.
Prerequisite
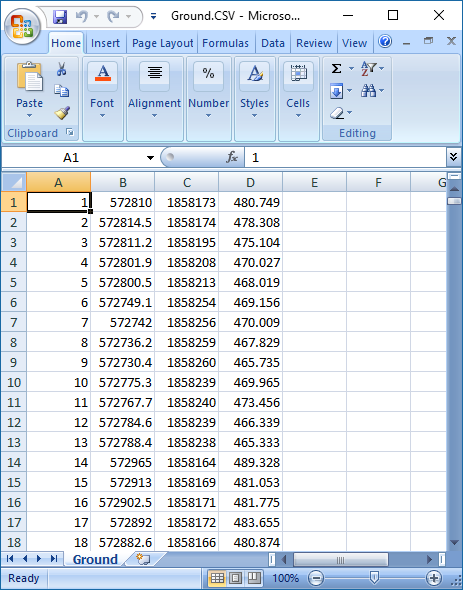
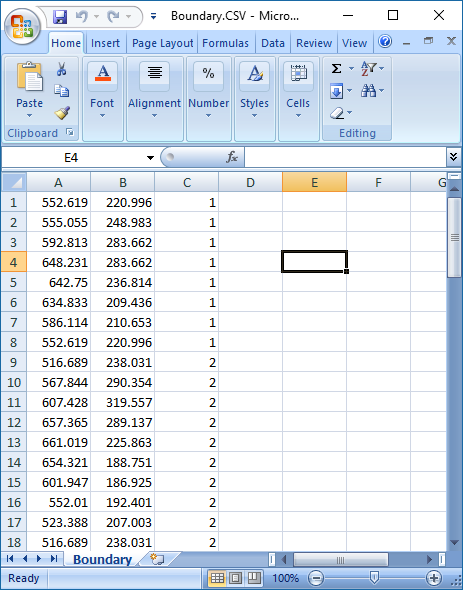
CSV file containing point data. In CSV file Easting (X), Northing (Y) and Elevation (Z) Co-ordinates are expected in the contour input file. CSV file may contain additional column data like Serial Number, Code (Remark) but, having X (Easting), Y (Northing) and Z (Elevation/Level) data is mandatory. It may be kindly noted that the units are to be only in metric system. In the CSV file Easting, Northing and elevation are required to be in Metres only.
Example CSV File
Although it is not compulsory to give boundary data, we strongly recommend you to provide the boundary definition file as input for better results. You can create the boundary definition file from your CAD drawing using the free lisp program provided in the download section.
If you don’t have boundary definition file, you can give a factor called Scanning Radius to help the application prepare an approximate boundary. You have to specify Scanning Radius as a factor which indicates approximately at what distances your input data is captured.
Know Software Limits
Online application ESurveyCAD will not generate the contour map for any input given. Before processing the file following limits are checked and only if input data is within specified limits, then the process will continue.
How to Generate the Contour Map Online?
Once you are ready with input file. Login to www.esurveycad.com with your email id and respective password.
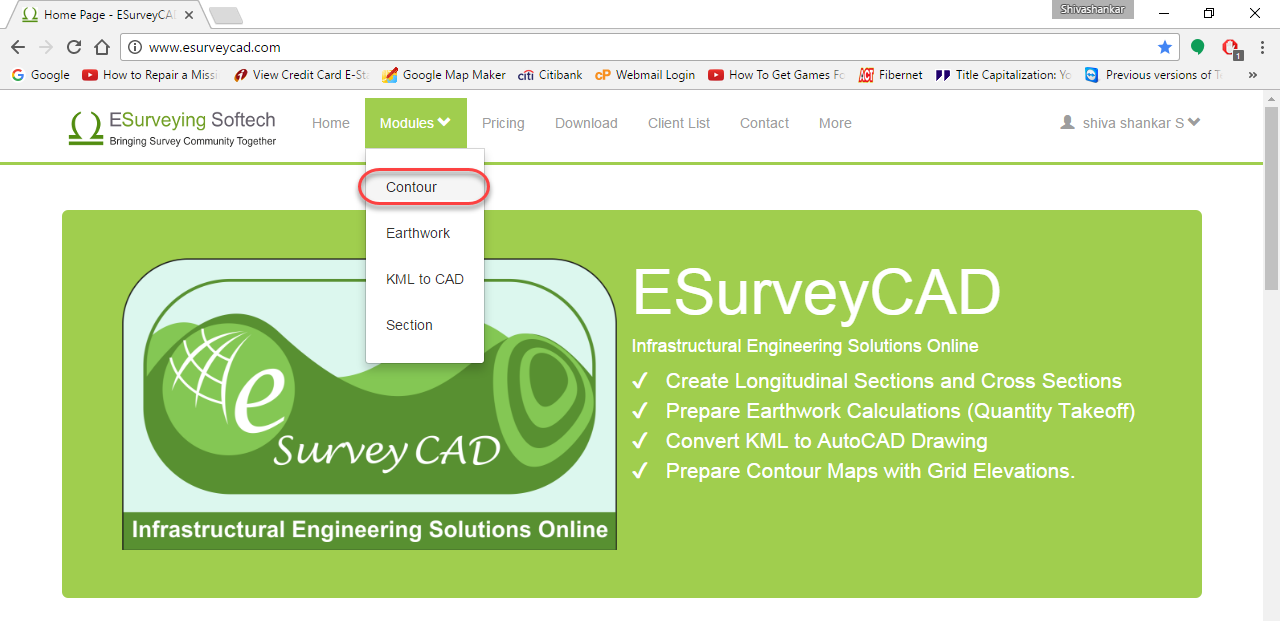
Select Contour option from modules drop down menu.
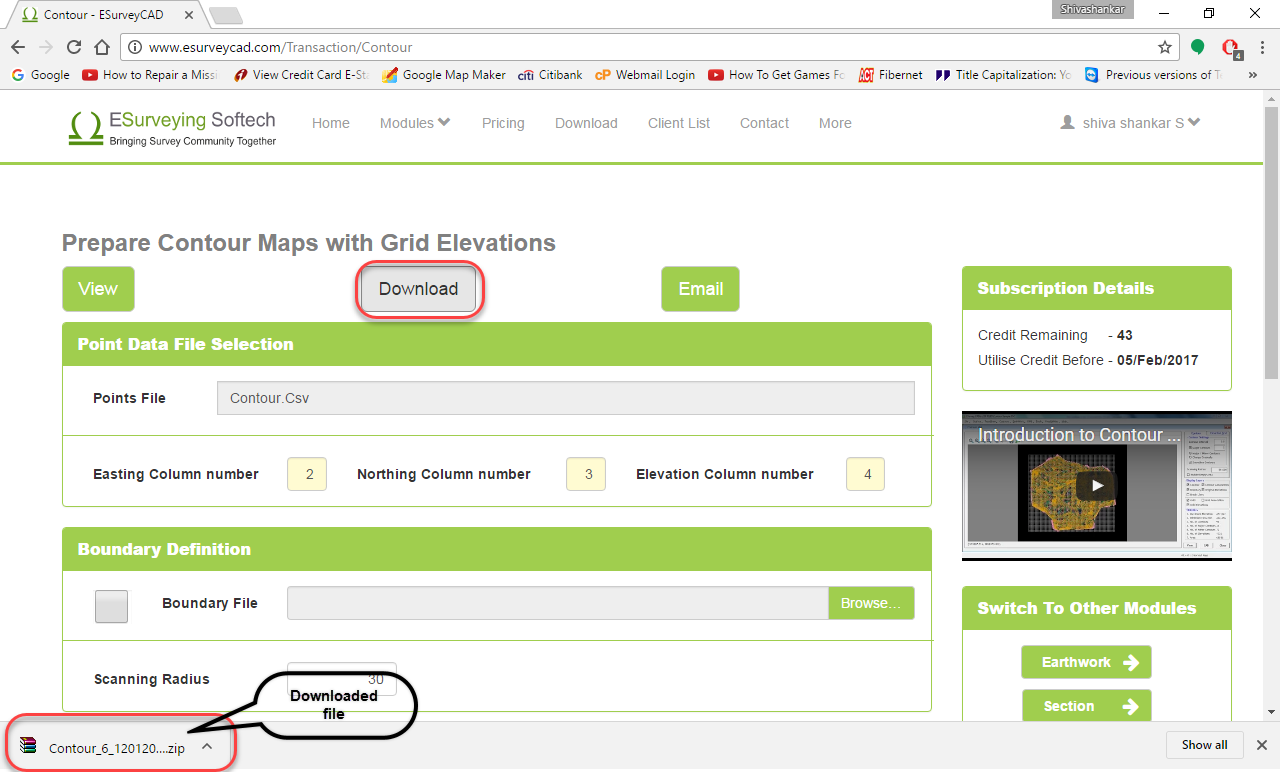
Click on Browse button and locate the CSV file from your computer. Depending on the headings in the CSV file mention the column numbers in which Easting (X), Northing (Y) & Elevation data are located.
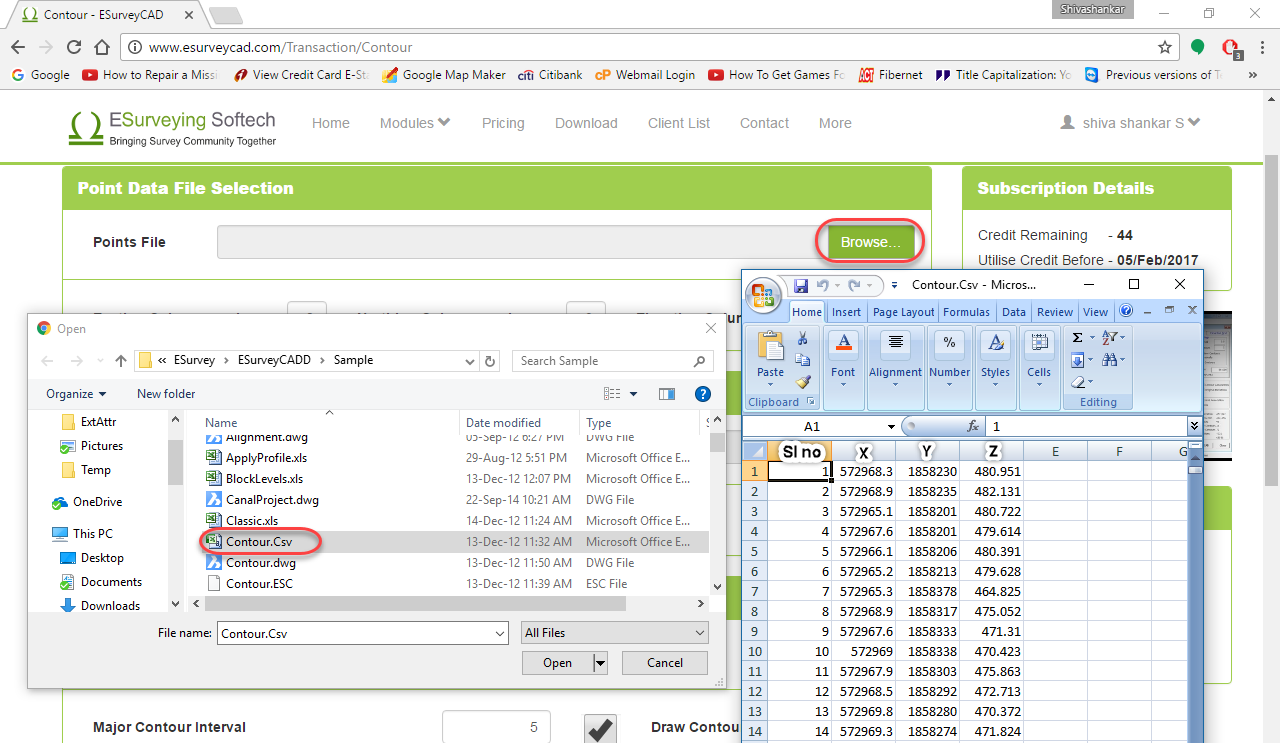
Note: If you have elevation data in drawing, please download ESurveyCAD lisp from the download section and run “EXPD” command and create a CSV file (Point Data) from your CAD drawing.
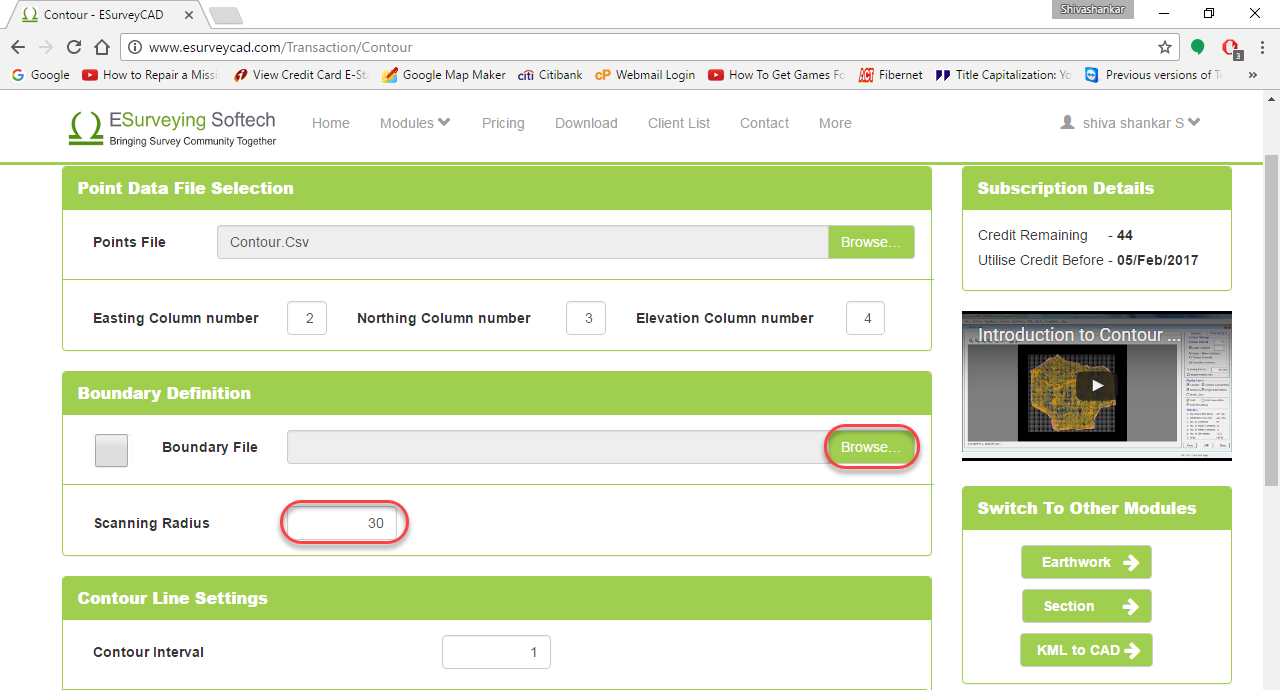
If you have the boundary definition file, select the same using Browse button. If you have a boundary in CAD use ESurveyCAD lisp and run “ExBound” command to generate the boundary file. In case if you don’t have boundary definition and expect the software to create a rough boundary then specify Scanning Radius (Approxiate Average Distance).
Sample Boundary.CSV file
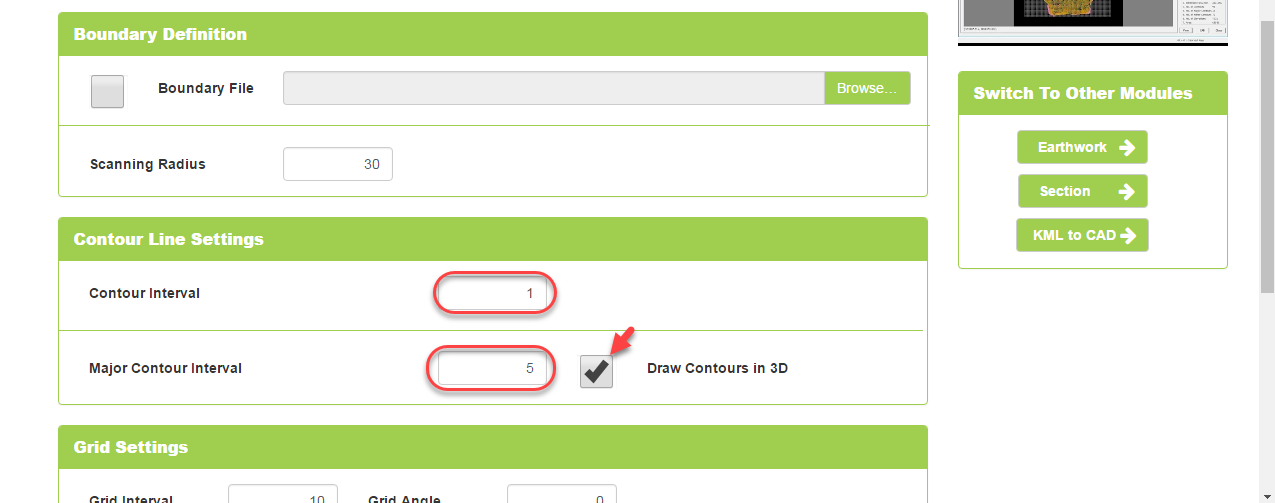
Specify the Contour Intervals as per requirement.
Specify the grid interval of your choice. Normally 5 M or 10 M is preferred in most of the contour map as grid interval. By defult software will compute grid with 0,0 as the base. If you want to shift the grid lines to some other reference point, specify Easting (X) and Northing (Y) coordinates of that point on which the grid lines should pass through.
In case if you want the grid lines to be drawn at an angle, Specify the same. Value need to be between 0 and 90.
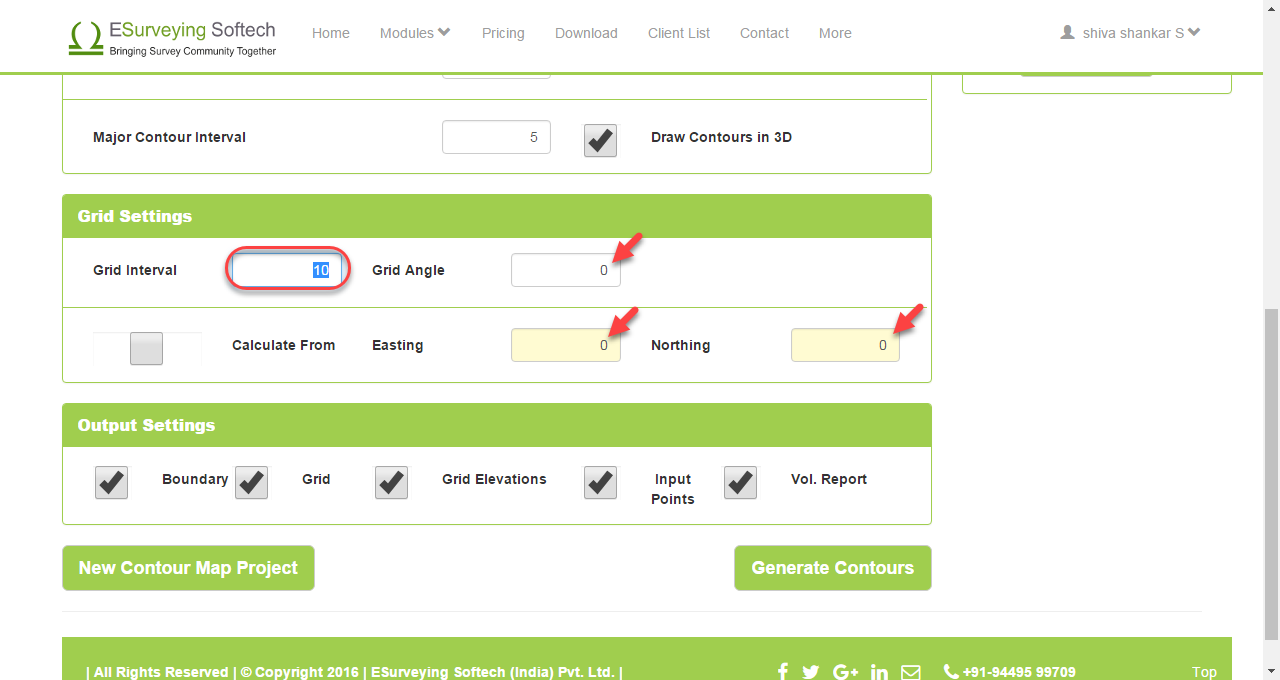
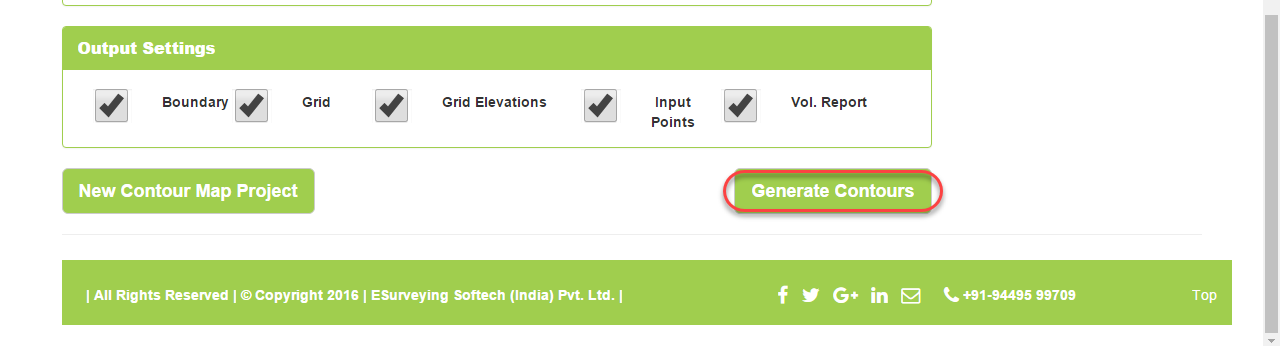
Select the Output layers.
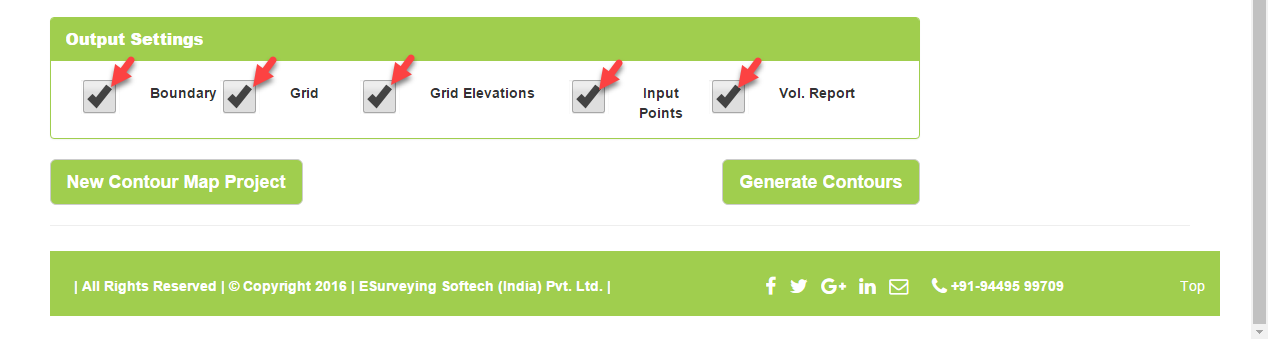
Click on Generate Contours and wait for a while. Once the point data is processed and drawing is generated, software will show 3 more buttons at the top.
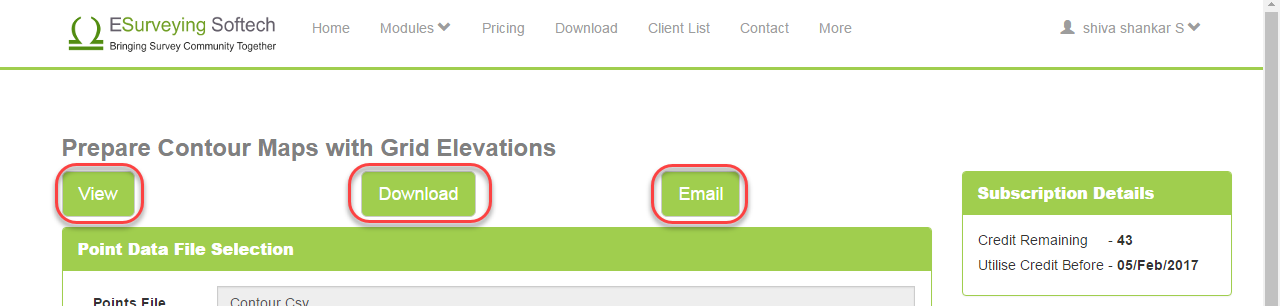
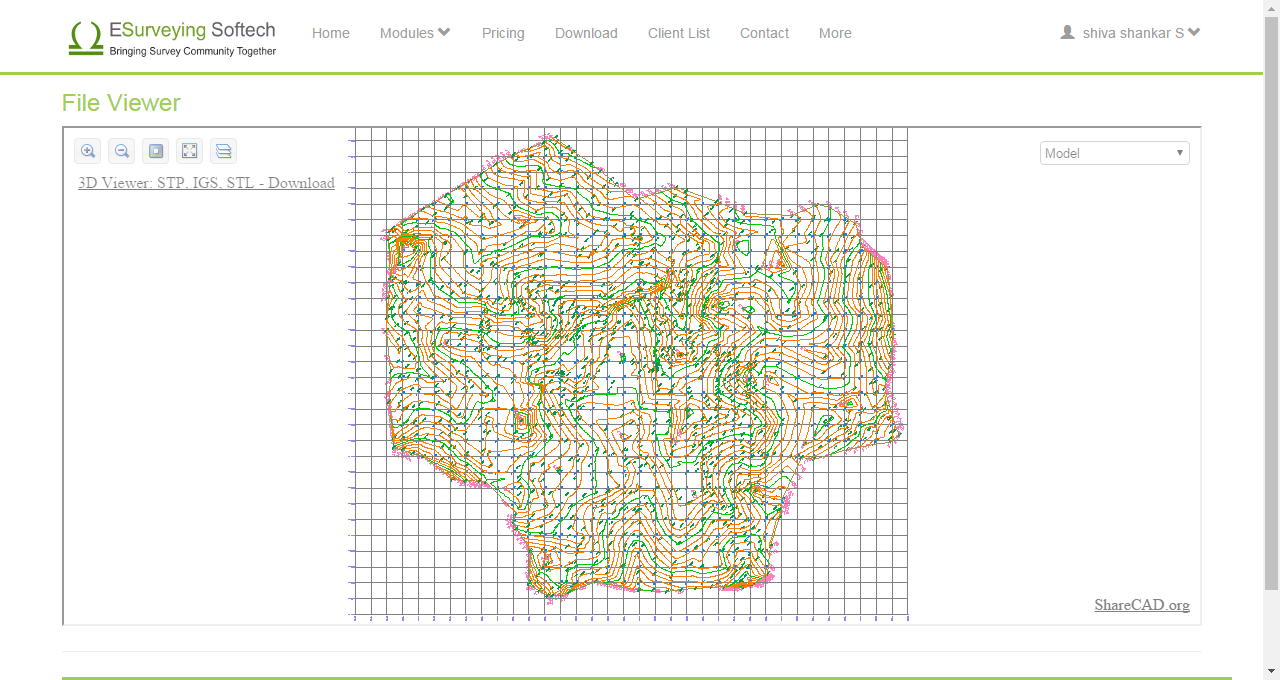
Click on View button to immediately see the generated Contour Map.
Click on the Download button, In case if you want to download the drawing
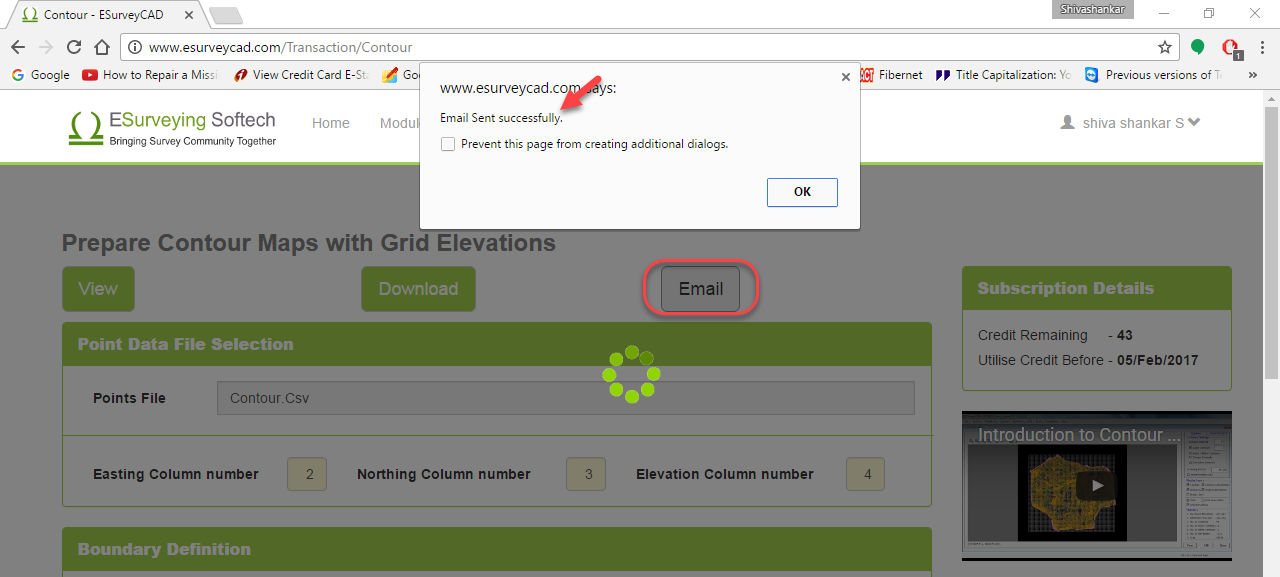
Click on Email button, In case if you want to download the drawing later. When you chose this option, file link is emailed to you. Please note that you have to download the required file within 24 hours. Later these drawings are deleted forever from the application(Server).
Terminologies
A contour map is a map illustrated with contour lines, for example, a topographic map, which thus shows valleys and hills, and the steepness of slopes. In other words, a topographic map of which the shape of the land surface is shown by contour lines, the relative spacing of the lines indicating the relative slope of the surface.
Contour is an imaginary line on ground joining points of equal or constant elevations
Scanning radius is a factor which you need to specify to help the software compute the imaginary boundary in case if you already don’t have a boundary. You need to specify the average distance at which you have taken elevation during the survey and depending on triangulation and this factor software will compute an imaginary boundary.
It is common practice to represent the lines in survey drawings with lines at an equal interval which looks like series of squares. The interval may vary depending upon the nature of the terrain, the contour interval required and the scale of the map desired.
When the original survey is done, and the points are scattered (random). To make maps more readable elevations are interpolated at each grid line intersection. Elevations of these intersection points are called grid elevation.
The vertical distance between any two consecutive contours is known as a contour interval. In other terms interval between consecutive contour lines in the contour map. Normally 1 Meter interval is specified for hilly terrain and 0.25 Meters or 0.50 Meters for other terrains.
This interval depends upon,
Lines generated in Contour map can be 2D line (Without Elevation Value) or 3D line (With elevation Value). ESurveyCAD allows you to generate Contours either in 2D or 3D.
CSV stands for Comma Separated Value. It is the simplest way of representing the table data in plain text format. Each column value is differentiated with Comma. A CSV file is a way to collect the data from any table so that it can be conveyed as input to another table-oriented application. If you have data in Excel it can be saved as CSV with Save as option in Excel.