

You can prepare multiple Cross Section or Longitudinal Section drawing by providing section values in CSV file. You can also generate Area and Volume report based on the input file. If the input file has 2 or more layers (series) information. You can define the different horizontal scale and vertical scale for preparing the drawings. You can define settings for automatically creating Cutting, Filling bands. You can interpolate the input data before creating the cross section. This module is helpful for creating Cross Section and Longitudinal Section for projects like Road, Railway, Canal, Pipeline, and Drain Etc.
Prerequisite
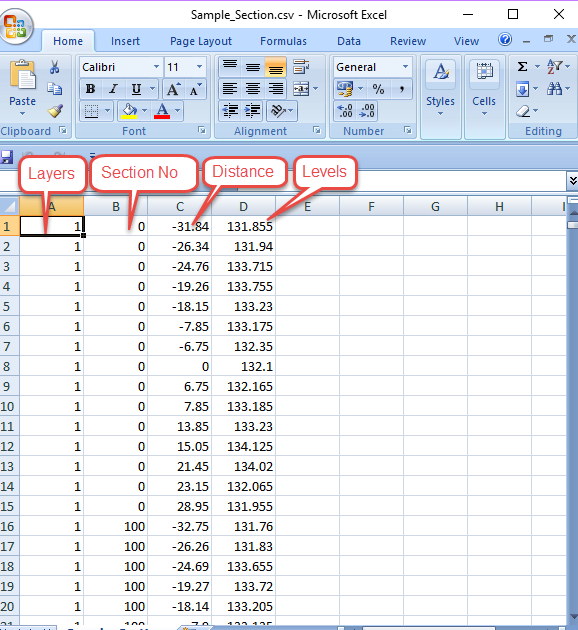
CSV file containing section data. CSV file need to contain Layer Number, Section Number, Distance and Elevation (Z) as 1st, 2nd, 3rd and 4th All the units are to be in the metric system.Example CSV File
Know Software Limits:
Online application ESurvey CAD will not generate the LS & CS for any input given. Before processing the file following limits are checked and only if input data is within specified limits, then the process will continue.
How to generate the Longitudinal Section & Cross Section online?
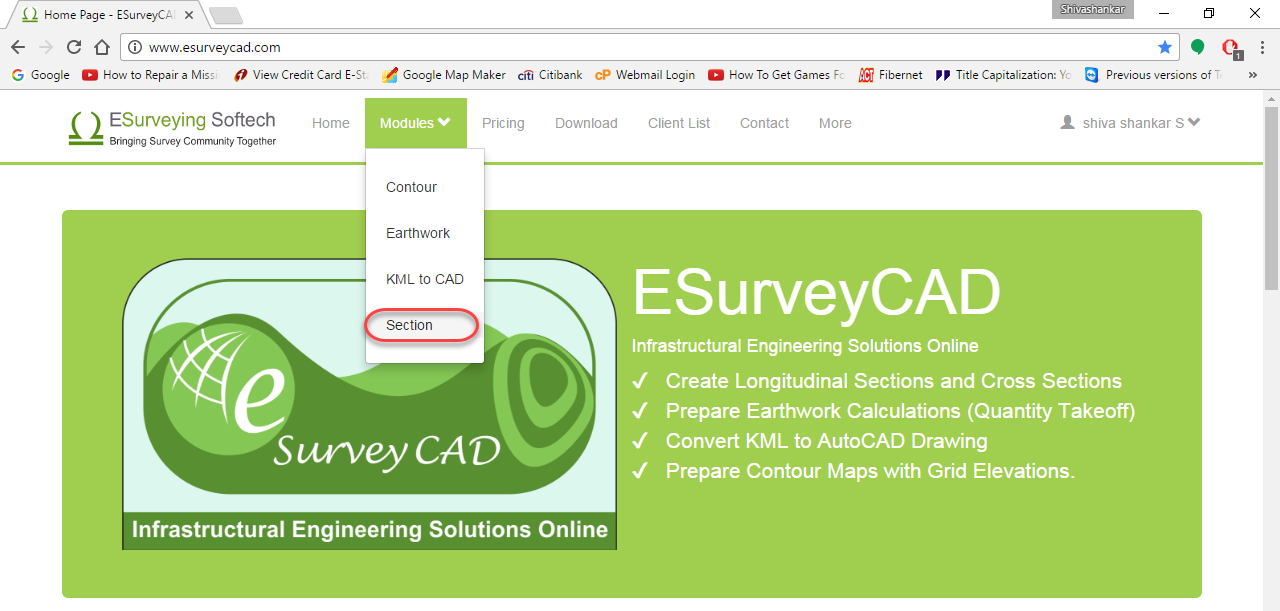
Once you are ready with input file. Login to www.esurveycad.com with your email id and respective password.
Select Section option from Modules drop down menu.
Click on Browse button and locate the CSV file from your computer.
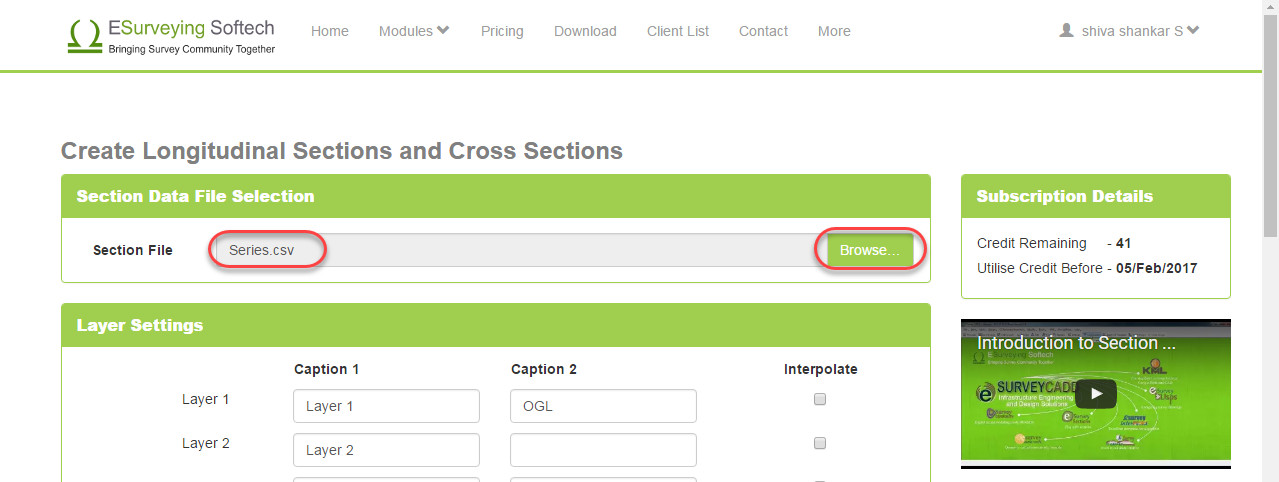
You need to specify required Settings, to before you generate Longitudinal Sections or Cross Sections.
Layer Settings
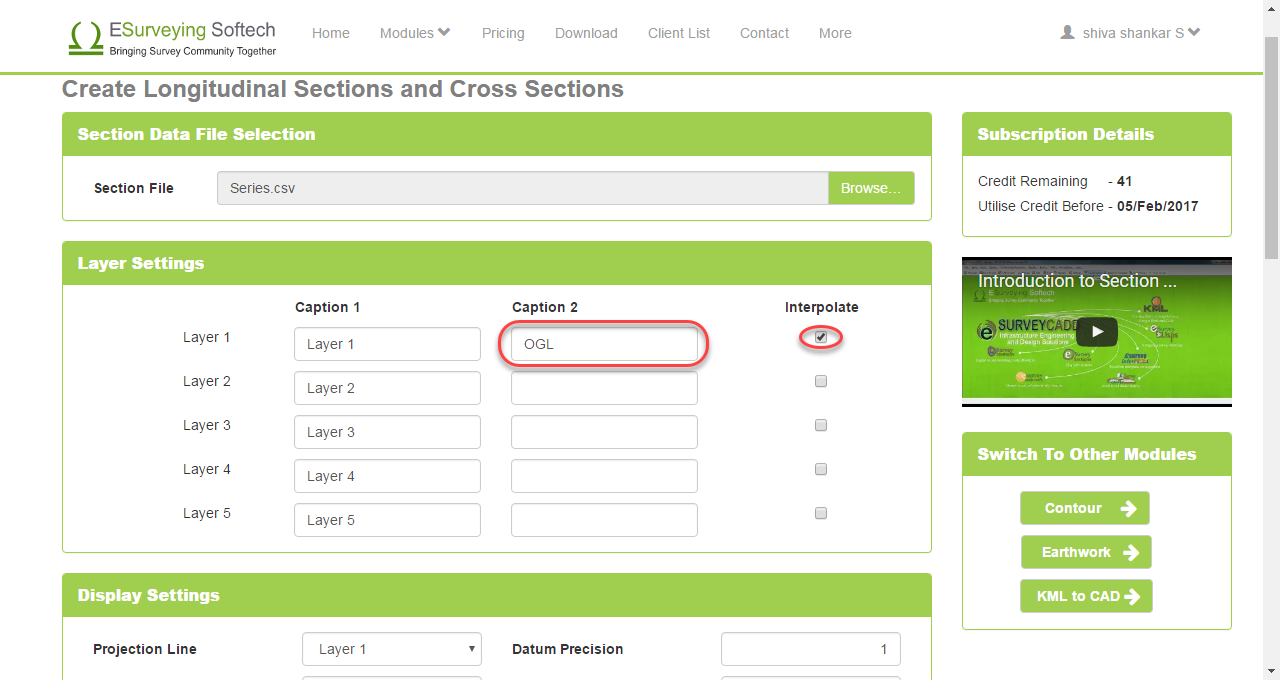
The application allows you to import data up to 5 series, which means that data for 5 layers can be imported. Depending on the number of layers (series) data you are importing, specify heading for each series. For Example, Ground Level or OGL for Layer 1.
In case, if you want the application to interpolate (explanation and the concept of interpolation are detailed below) the imported series data, then switch on the respective check box.
Display Settings
In display settings, you can select for which layer data you want Projection Line. Specify Datum Precision and also mention the section Footer Captions.
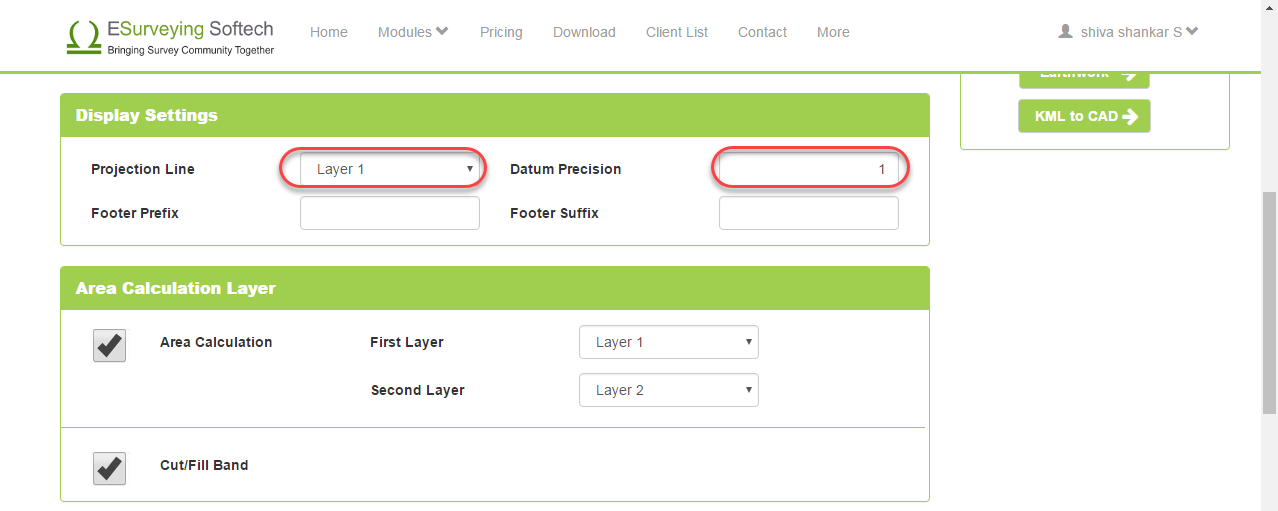
Area Calculation Layers
Select area calculation only in case if you have more than 2 layers of data in your input file. Select the layers among which area to be calculated. If you want cutting / filling value to be displayed in relation to area calculation layers, select Cut/Fill Band check box.
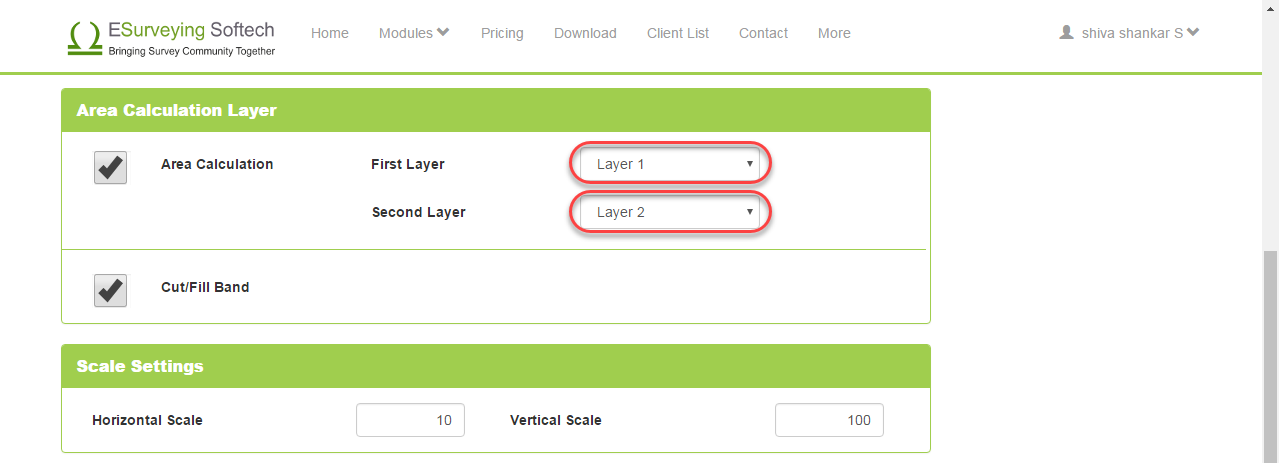
Scale Settings
In scale setting option, specify the Horizontal and Vertical Scale values.
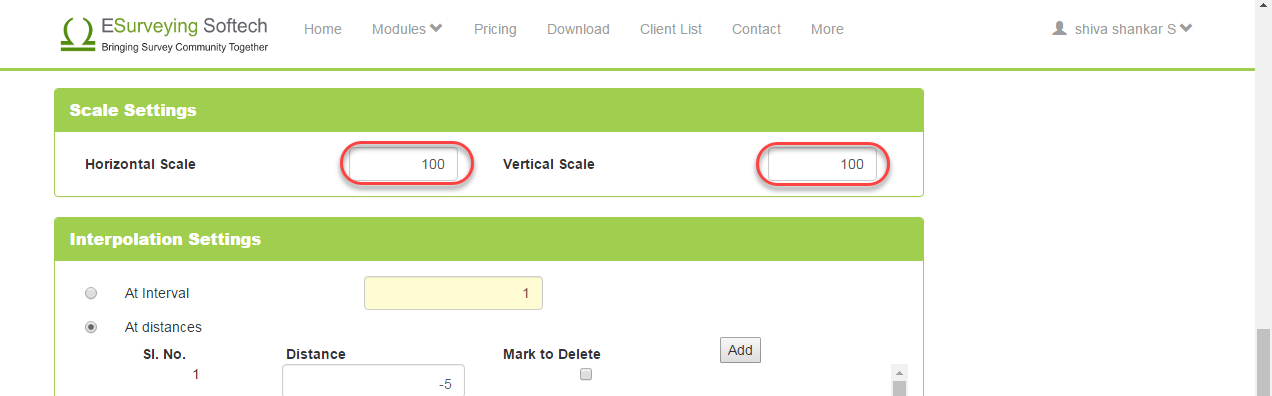
Interpolation Settings
In case if you want the application to interpolate the imported layer values. Specify your interpolation choices.
If you select and specify At Interval option then, the software will interpolate values at equal intervals. Say if you specify ‘2’ as the value, then at each 2 meters, layer values will be interpolated considering ‘0’ as the reference. Instead, if you want the application to interpolate values at specific distances, then you can select At Distances option and specify the distances.
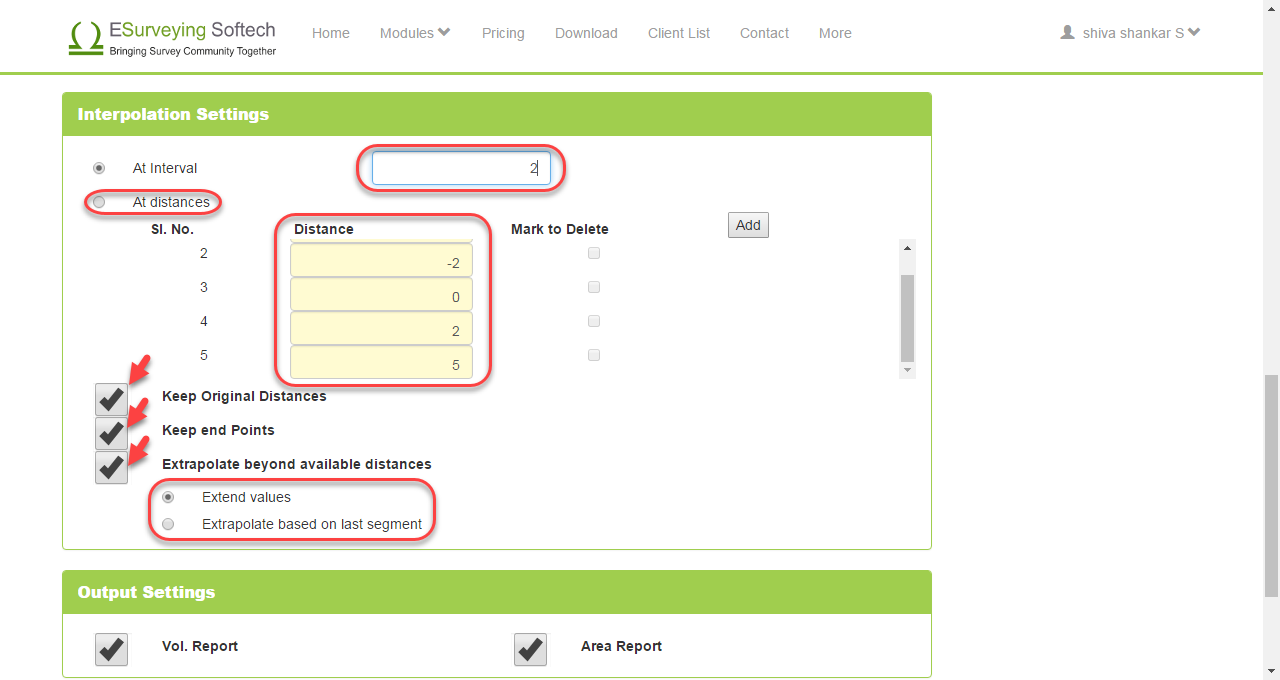
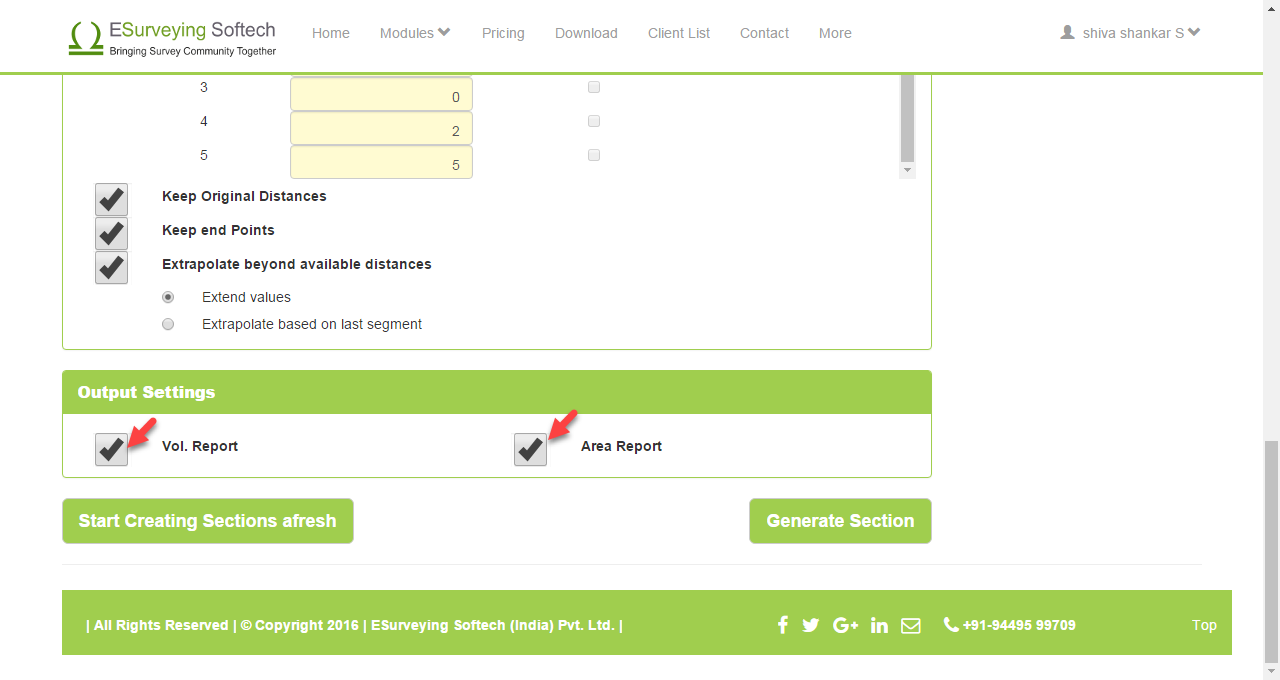
You also have the option to keep original values or delete them. If you switch it off, then only interpolated values will be considered in preparing the section.
The application also allows you to extrapolate or Extend the values beyond available distance for a given layer. This is an advanced option and is used rarely.
Output Settings
Section drawings will be prepared by default. You can generate Area / Volume report optionally, select required reports in output settings.
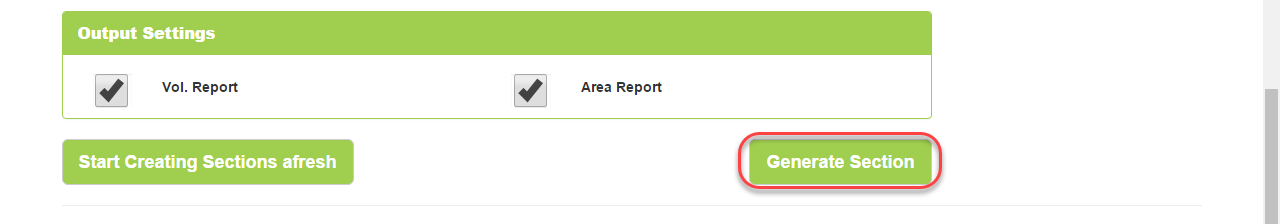
Click on Generate Section and wait for a while. Once the sections and reports are processed application will show 3 more buttons at the top.
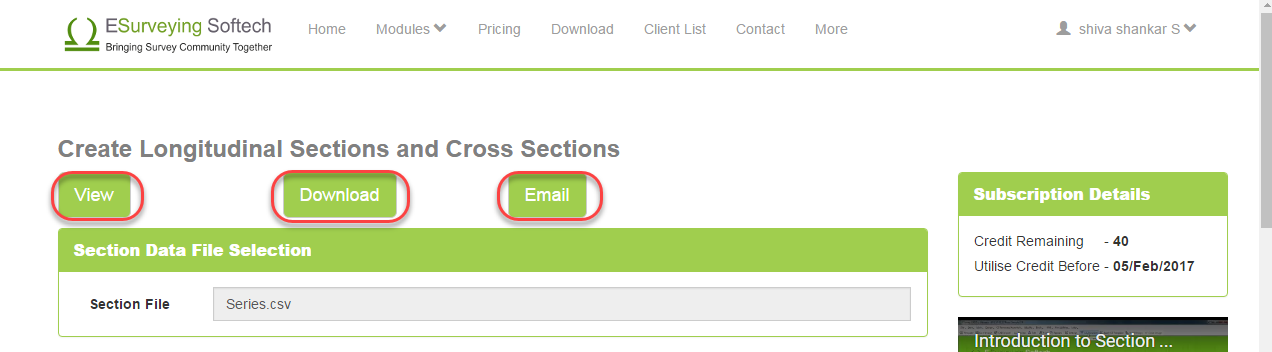
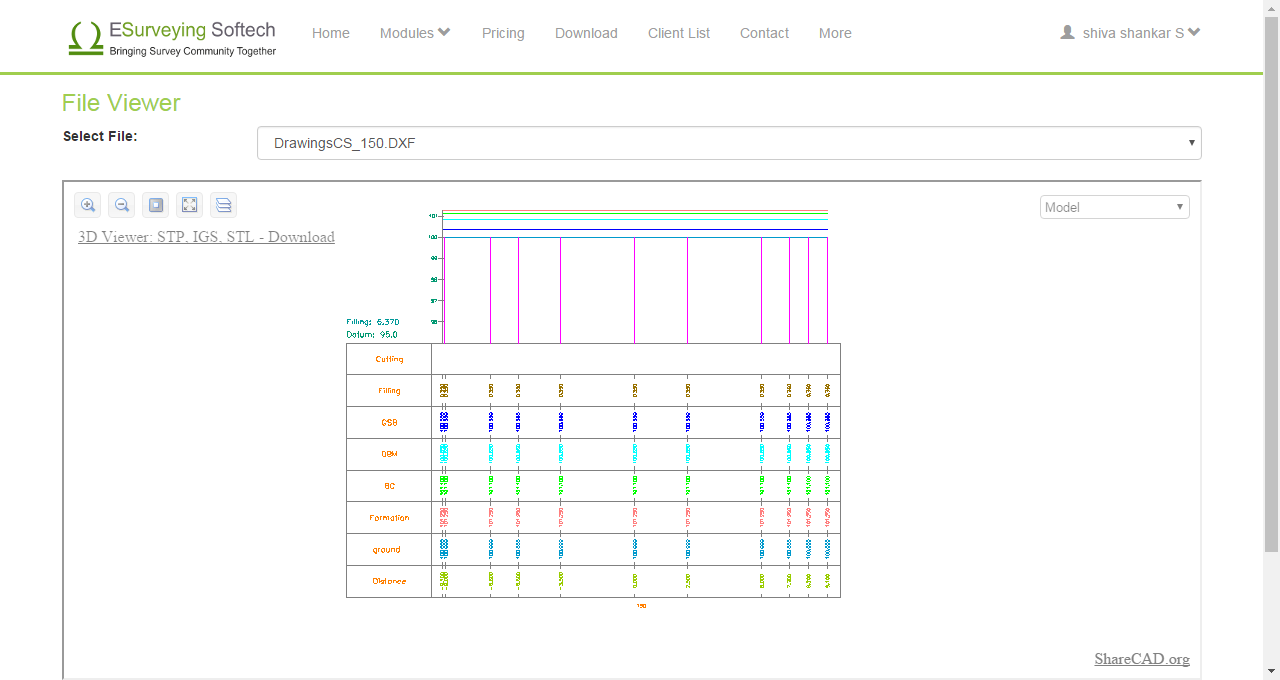
Click on View button to immediately see the generated section drawings.
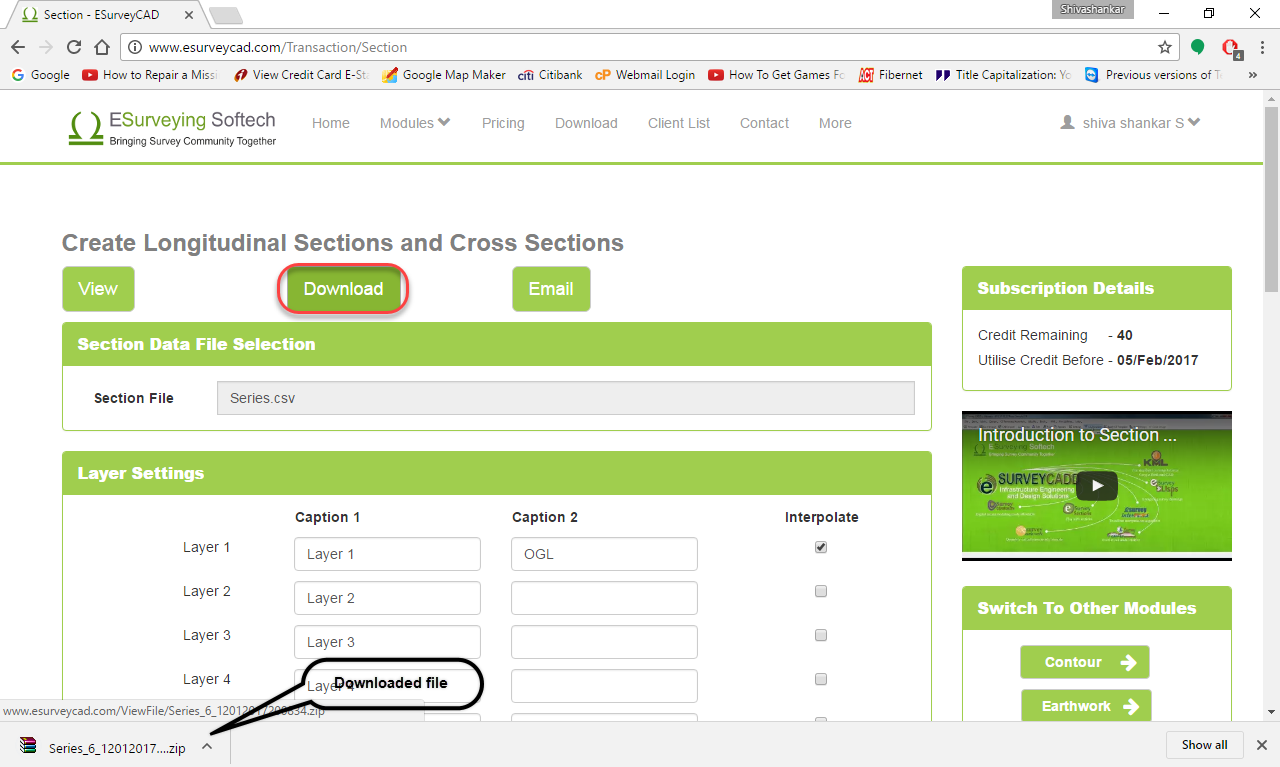
Click on Download button, In case if you want to download the drawings and reports.
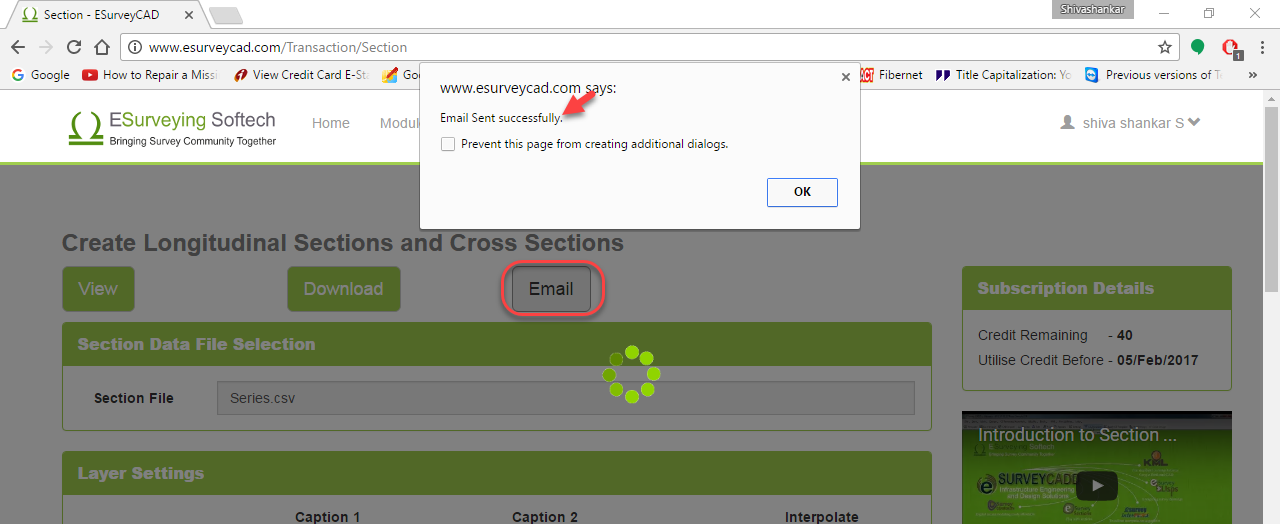
Click on Email button, In case if you want to download the drawing later. When you chose this option, link is emailed to you. Please note that you have downloaded the required file within 24 hours. Later these drawings are deleted forever from the application (Server).
Terminologies